How to debug webpack on Rails
Tips for debugging your Webpacker config
It's nice that the Rails Webpacker gem and NPM package abstracts your webpack config... that is until you need to make changes.
In my previous post, I talked about how to customize the webpack config... but how can you be sure you're making the right change? The webpack config is JavaScript, so you can't simply jump into the Rails console to poke around. But you do have some other tools at your disposal though.
In this post, I'll share some tips for debugging the webpack config in your Rails app.
The one-liner
For the following examples, I'm using Node v12.13.1.
Here's a quick one-liner for printing the entire Rails webpack config in development:
$ RAILS_ENV=development node -e 'console.dir(require("./config/webpack/development"), { depth: null })'
I like console.dir as a nice alternative to console.log for inspecting JavaScript objects.
For inspecting the test or production configs, just update the RAILS_ENV and the target file:
$ RAILS_ENV=development node -e 'console.dir(require("./config/webpack/development"), { depth: null })'
# OR
$ RAILS_ENV=test node -e 'console.dir(require("./config/webpack/test"), { depth: null })'
# OR
$ RAILS_ENV=production node -e 'console.dir(require("./config/webpack/production"), { depth: null })'
We ensure the RAILS_ENV is set so Webpacker's NPM package will load the correct settings from your config/webpacker.yml file.
To make it even easier, I'll put this into a script file in bin/inspect_webpack with my Rails projects.
#!/usr/bin/env sh

env=${RAILS_ENV:-development}
RAILS_ENV=${env} node -e "console.dir(require(\"./config/webpack/${env}\"), { depth: null })"
Then to run:
$ chmod a+x ./bin/inspect_webpack
$ ./bin/inspect_webpack
# OR
$ RAILS_ENV=test ./bin/inspect_webpack
# OR
$ RAILS_ENV=production ./bin/inspect_webpack
On the console
For an interactive experience, you can run node to pull up the Node.js REPL. This is especially helpful for isolating pieces of the webpack config "tree":
$ RAILS_ENV=development node
> const config = require('./config/webpack/development')
undefined
> console.dir(config, { depth: null })
{
  mode: 'development',
  output: {
// displays the entire webpack config
// ...
> console.dir(config.plugins, { depth: null })
// displays the plugins ...
// ...
As with the script I showed earlier, change the RAILS_ENV to inspect the configs for the other environments.
From the node console, you can also access and play around with the Webpack environment object directly:
> const { environment } = require('@rails/webpacker')
undefined
> environment.plugins.get('Manifest')
// displays configured WebpackAssetsManifest plugin
Debugging with DevTools
While the above examples help inspect the webpack config in a REPL, it may help to debug the config within the build process itself. It's possible to use the debugger provided by Chrome DevTools on a Node.js process (as opposed to a browser's JavaScript process).
For the following examples, I'm using Chrome Version 80.0.3987.163
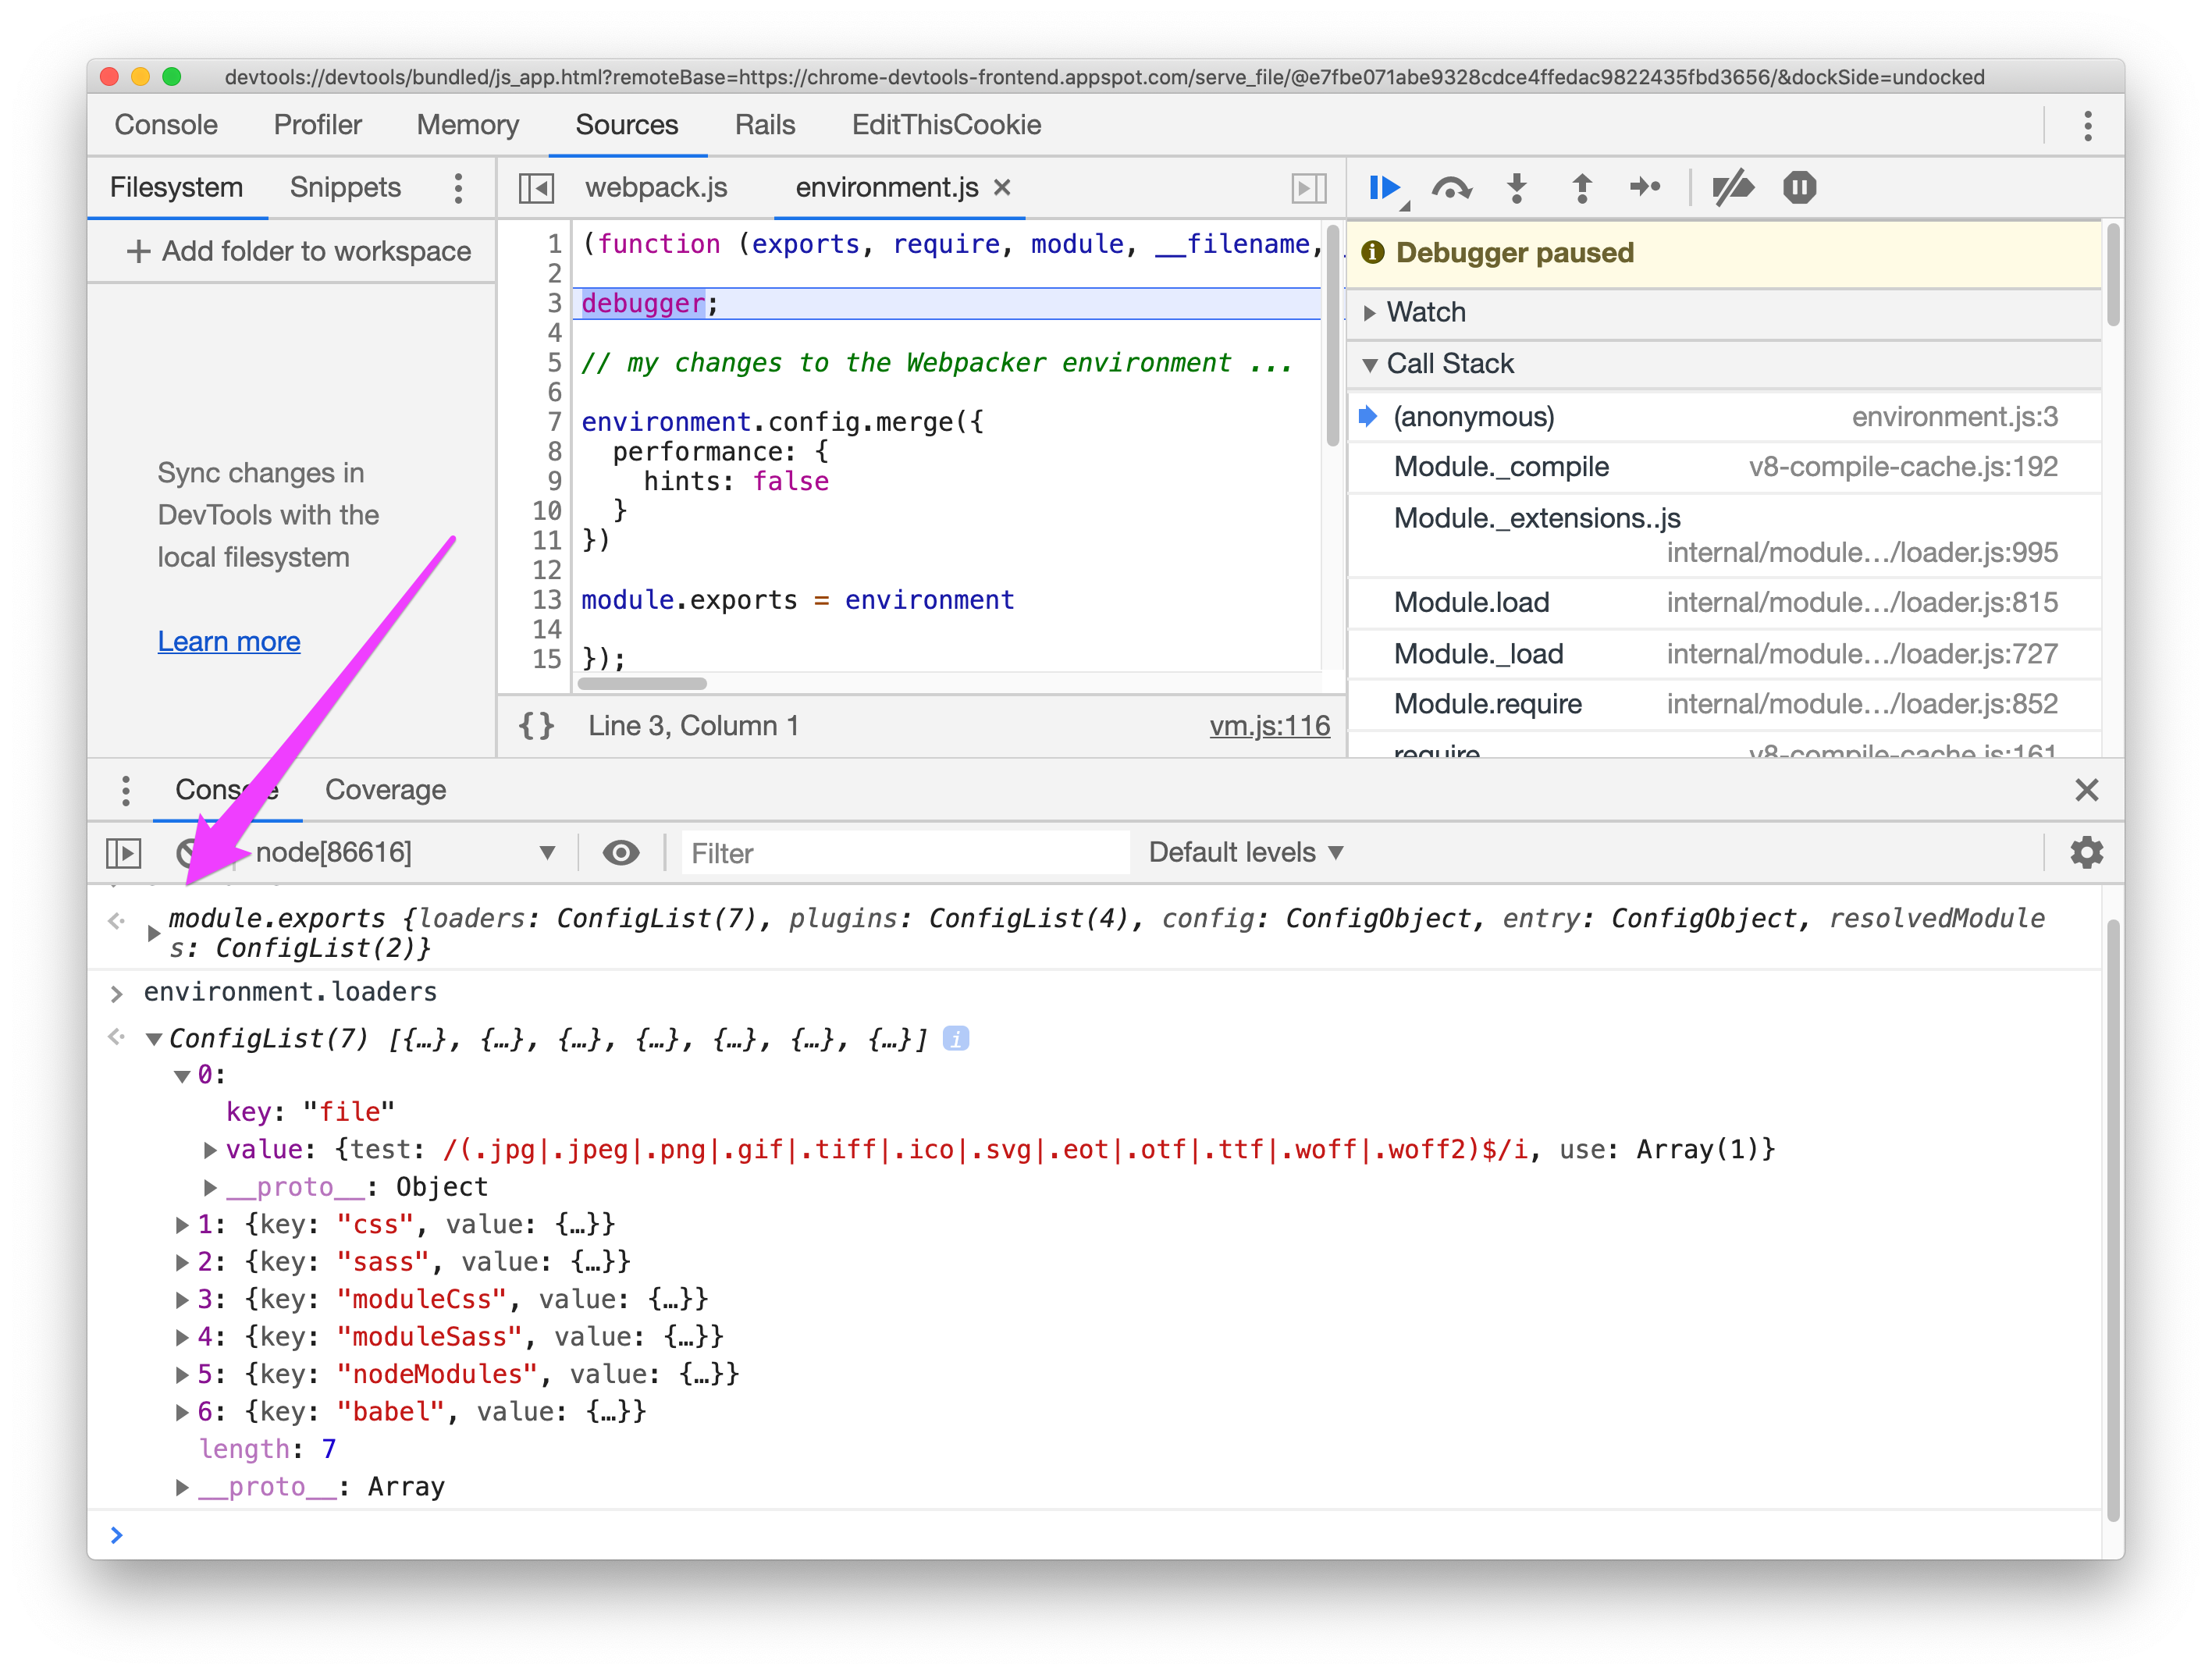
We could, for example, drop a debugger; statement into our Webpacker webpack config:
const { environment } = require('@rails/webpacker')

debugger

// changes I want to debug ...

module.exports = environment
We can then run the webpack build with the --debug flag:
$ ./bin/webpack --debug
which is in the local development environment is equivalent to:
$ RAILS_ENV=development node --inspect-brk yarn webpack --config ./config/webpack/development.js
Running the webpack process in debug mode will open up a websocket to communicate with Chrome DevTools:
$ ./bin/webpack --debug
Debugger listening on ws://127.0.0.1:9229/861b81ed-6f2f....
For help, see: https://nodejs.org/en/docs/inspector
Visit chrome://inspect in your Chrome browser and we can find a link for our running Node process in the menu:
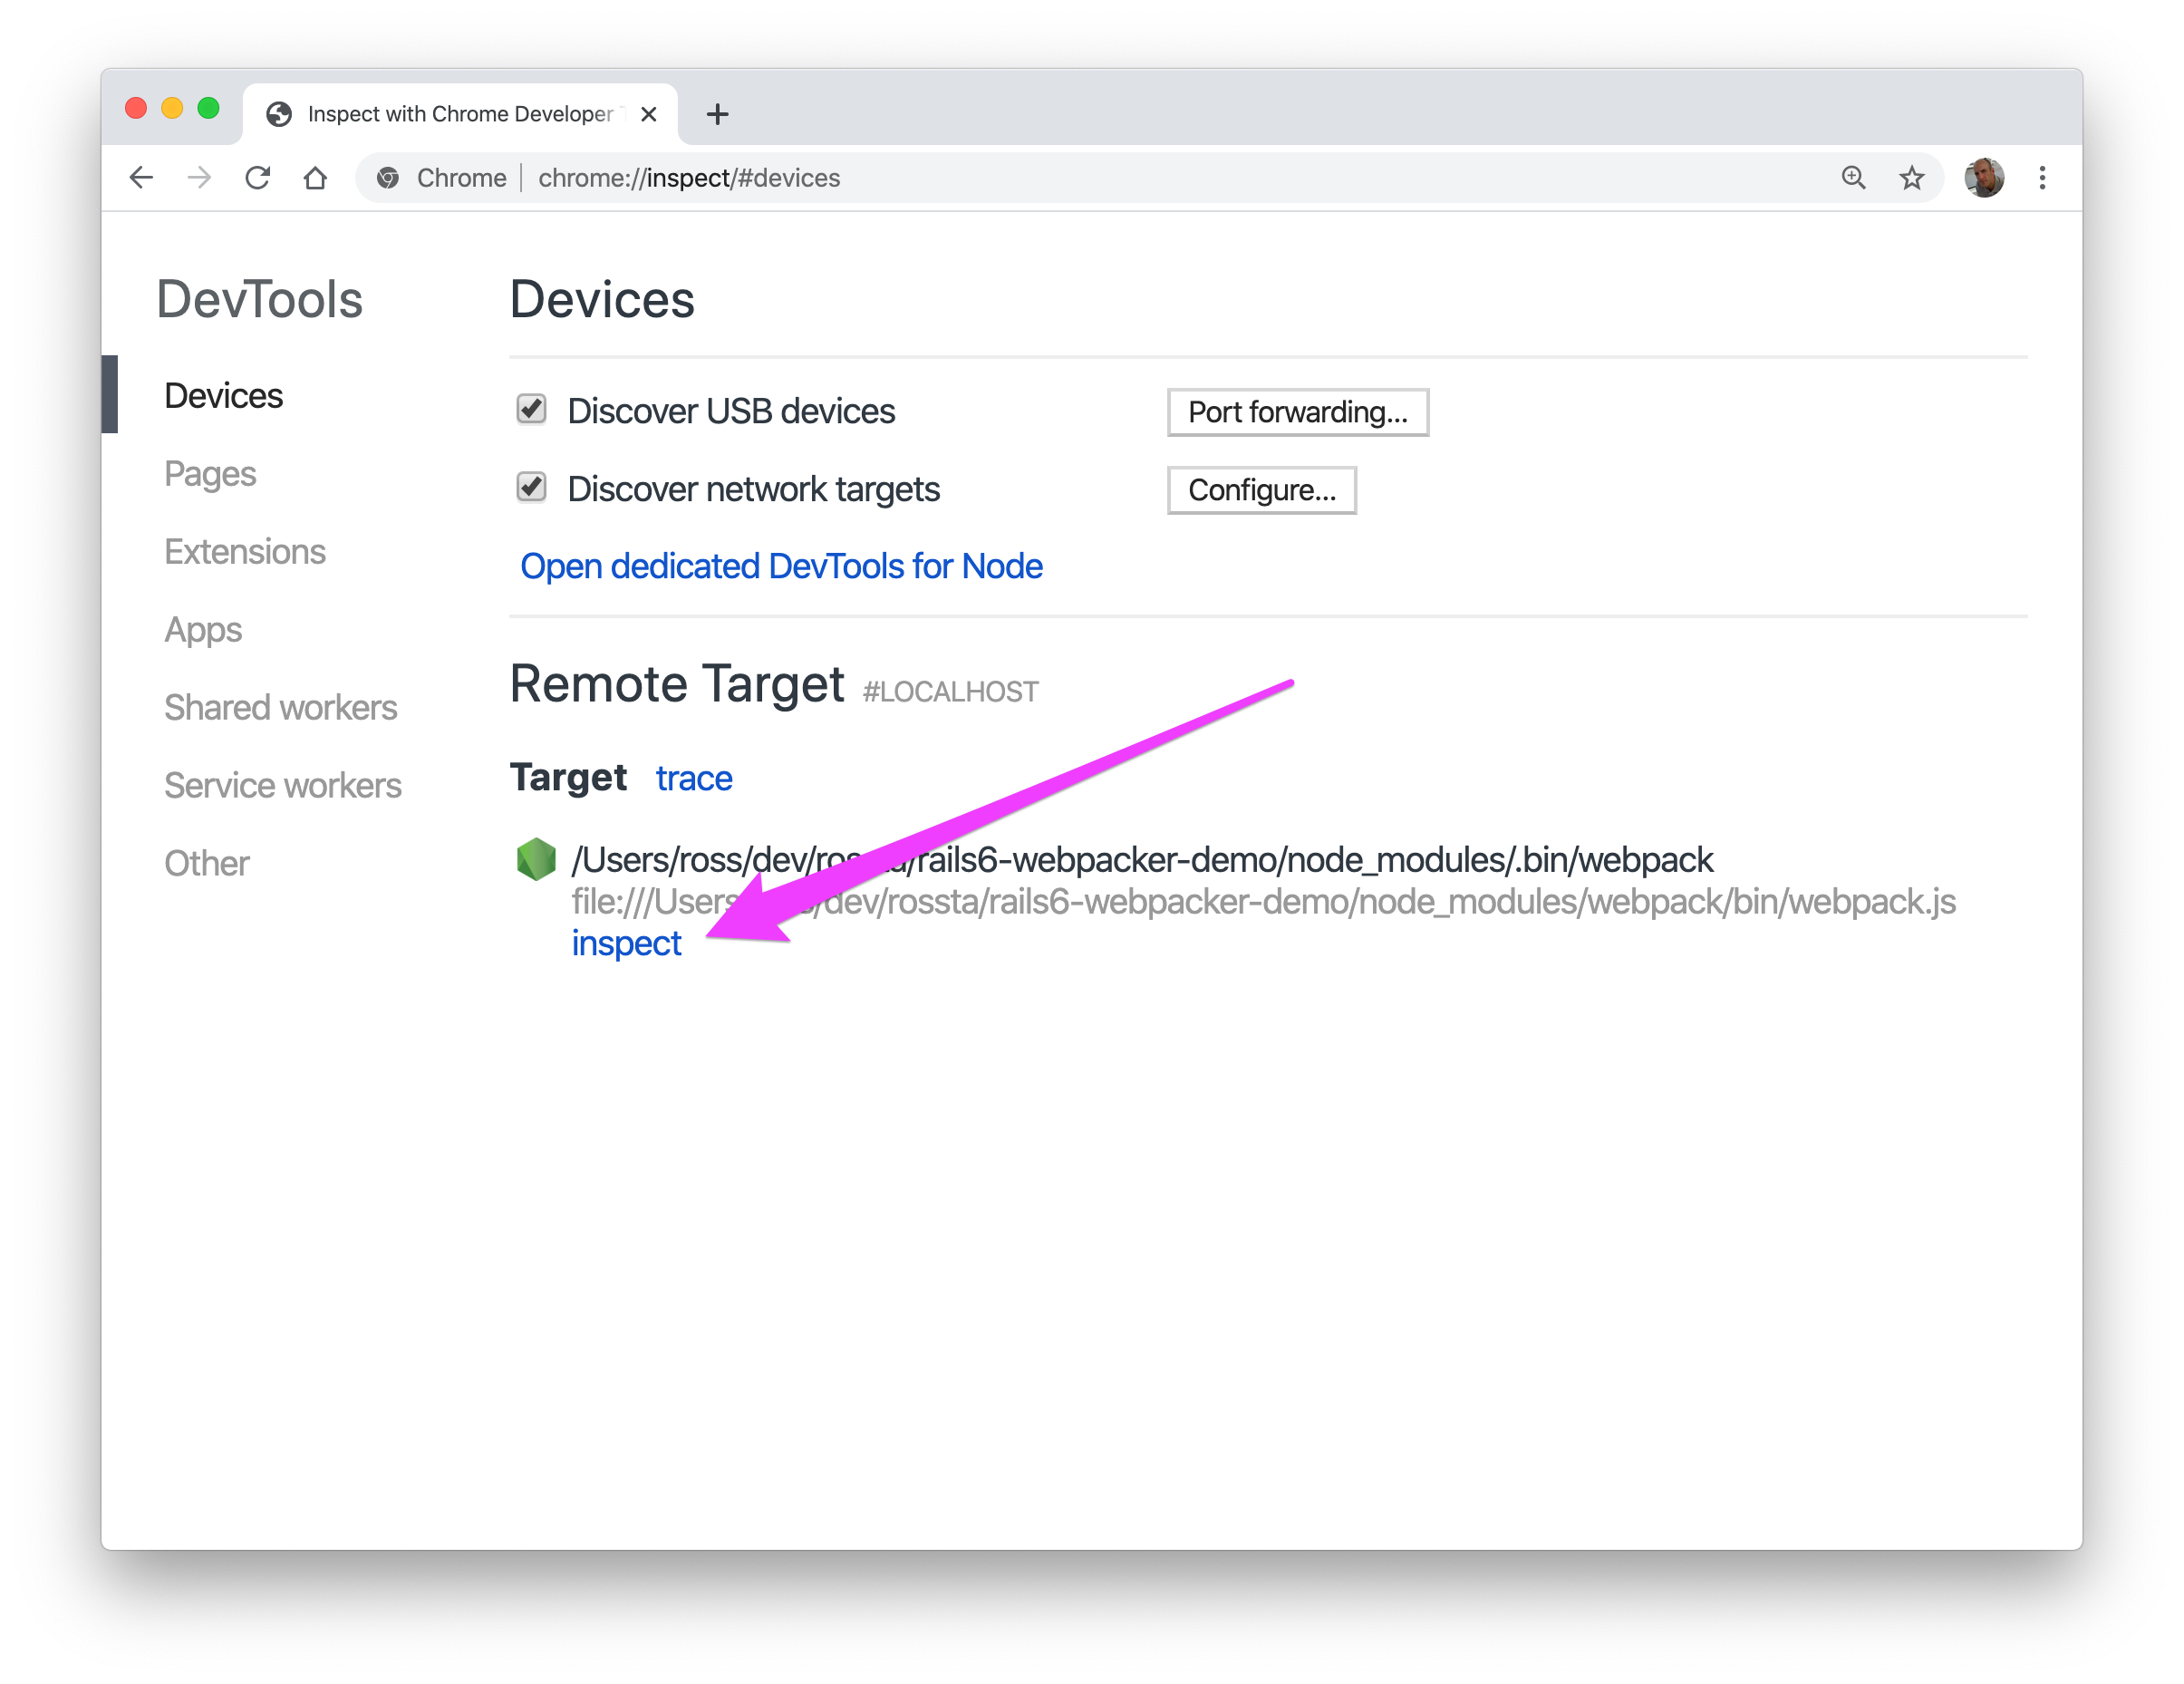
This will start a instance of the DevTools for your Node process where we can click "Play" to resume execution:
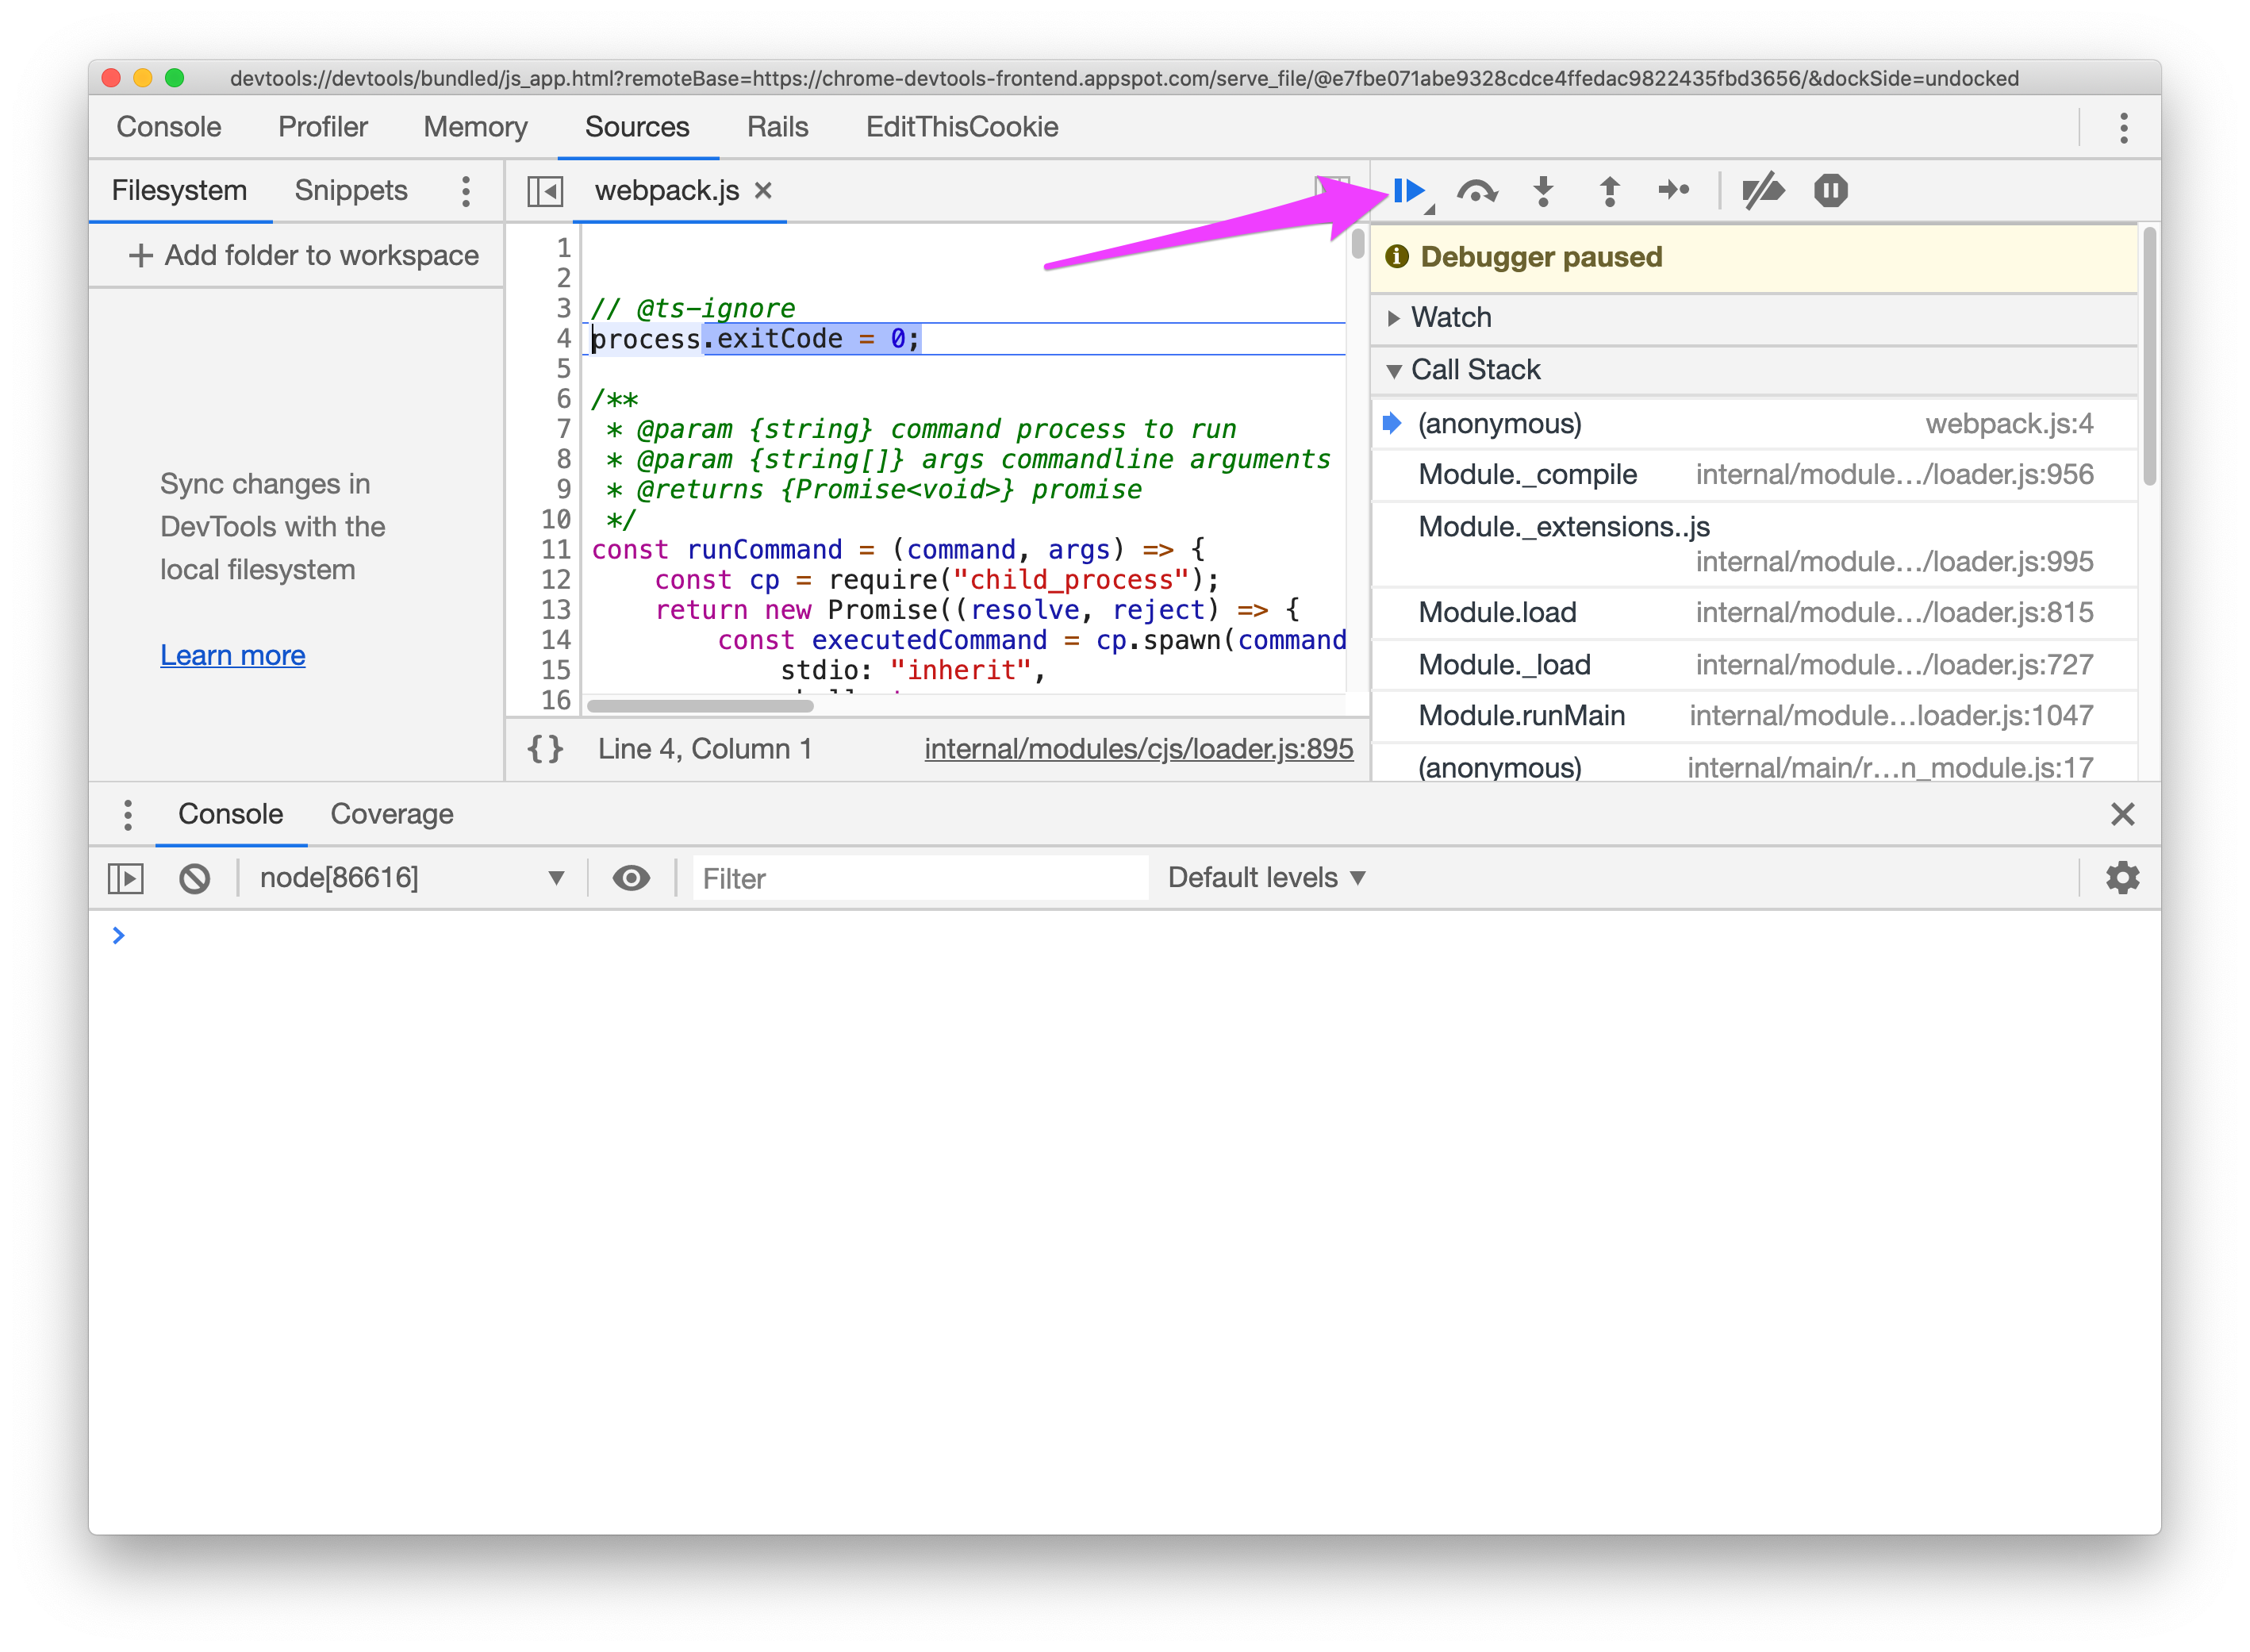
The process halts when it hits our debugger statement and we can modify values on the console:
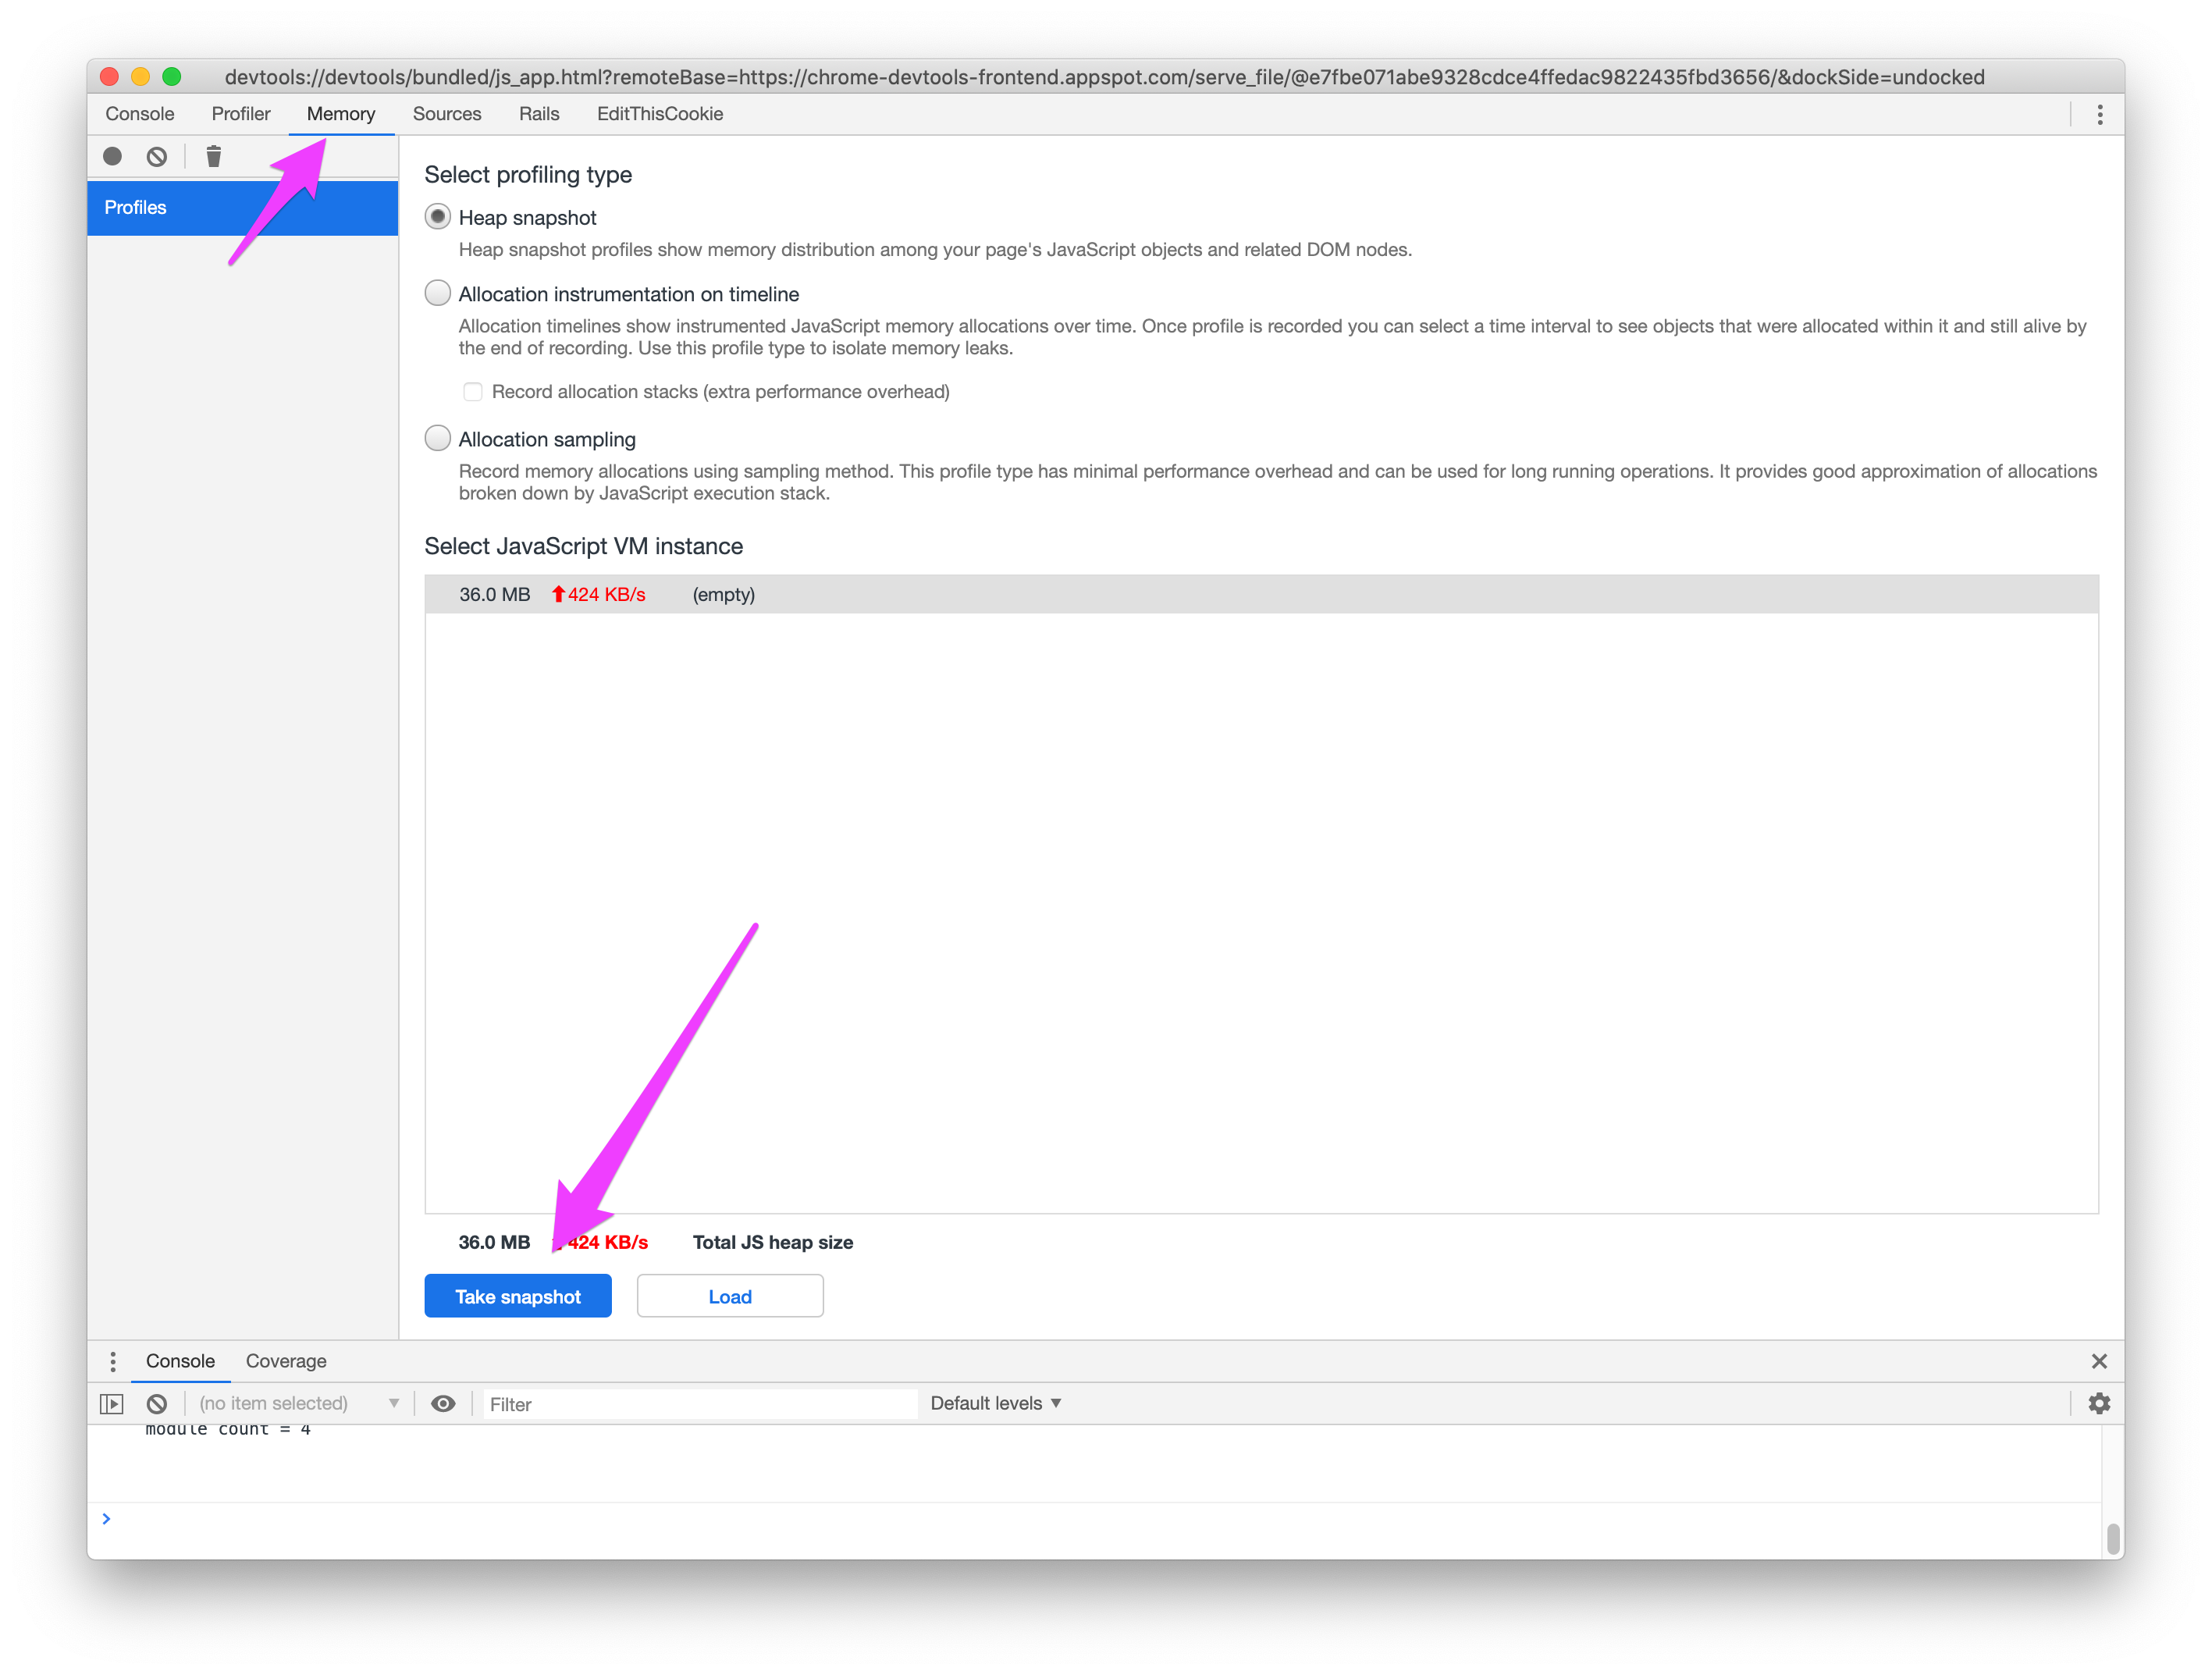
For larger (or misconfigured) projects, you may experience memory usage issues with the webpack build. The DevTools debugger also provides a Memory tab for taking heap snapshots and tracking down the memory hogs in your build process.
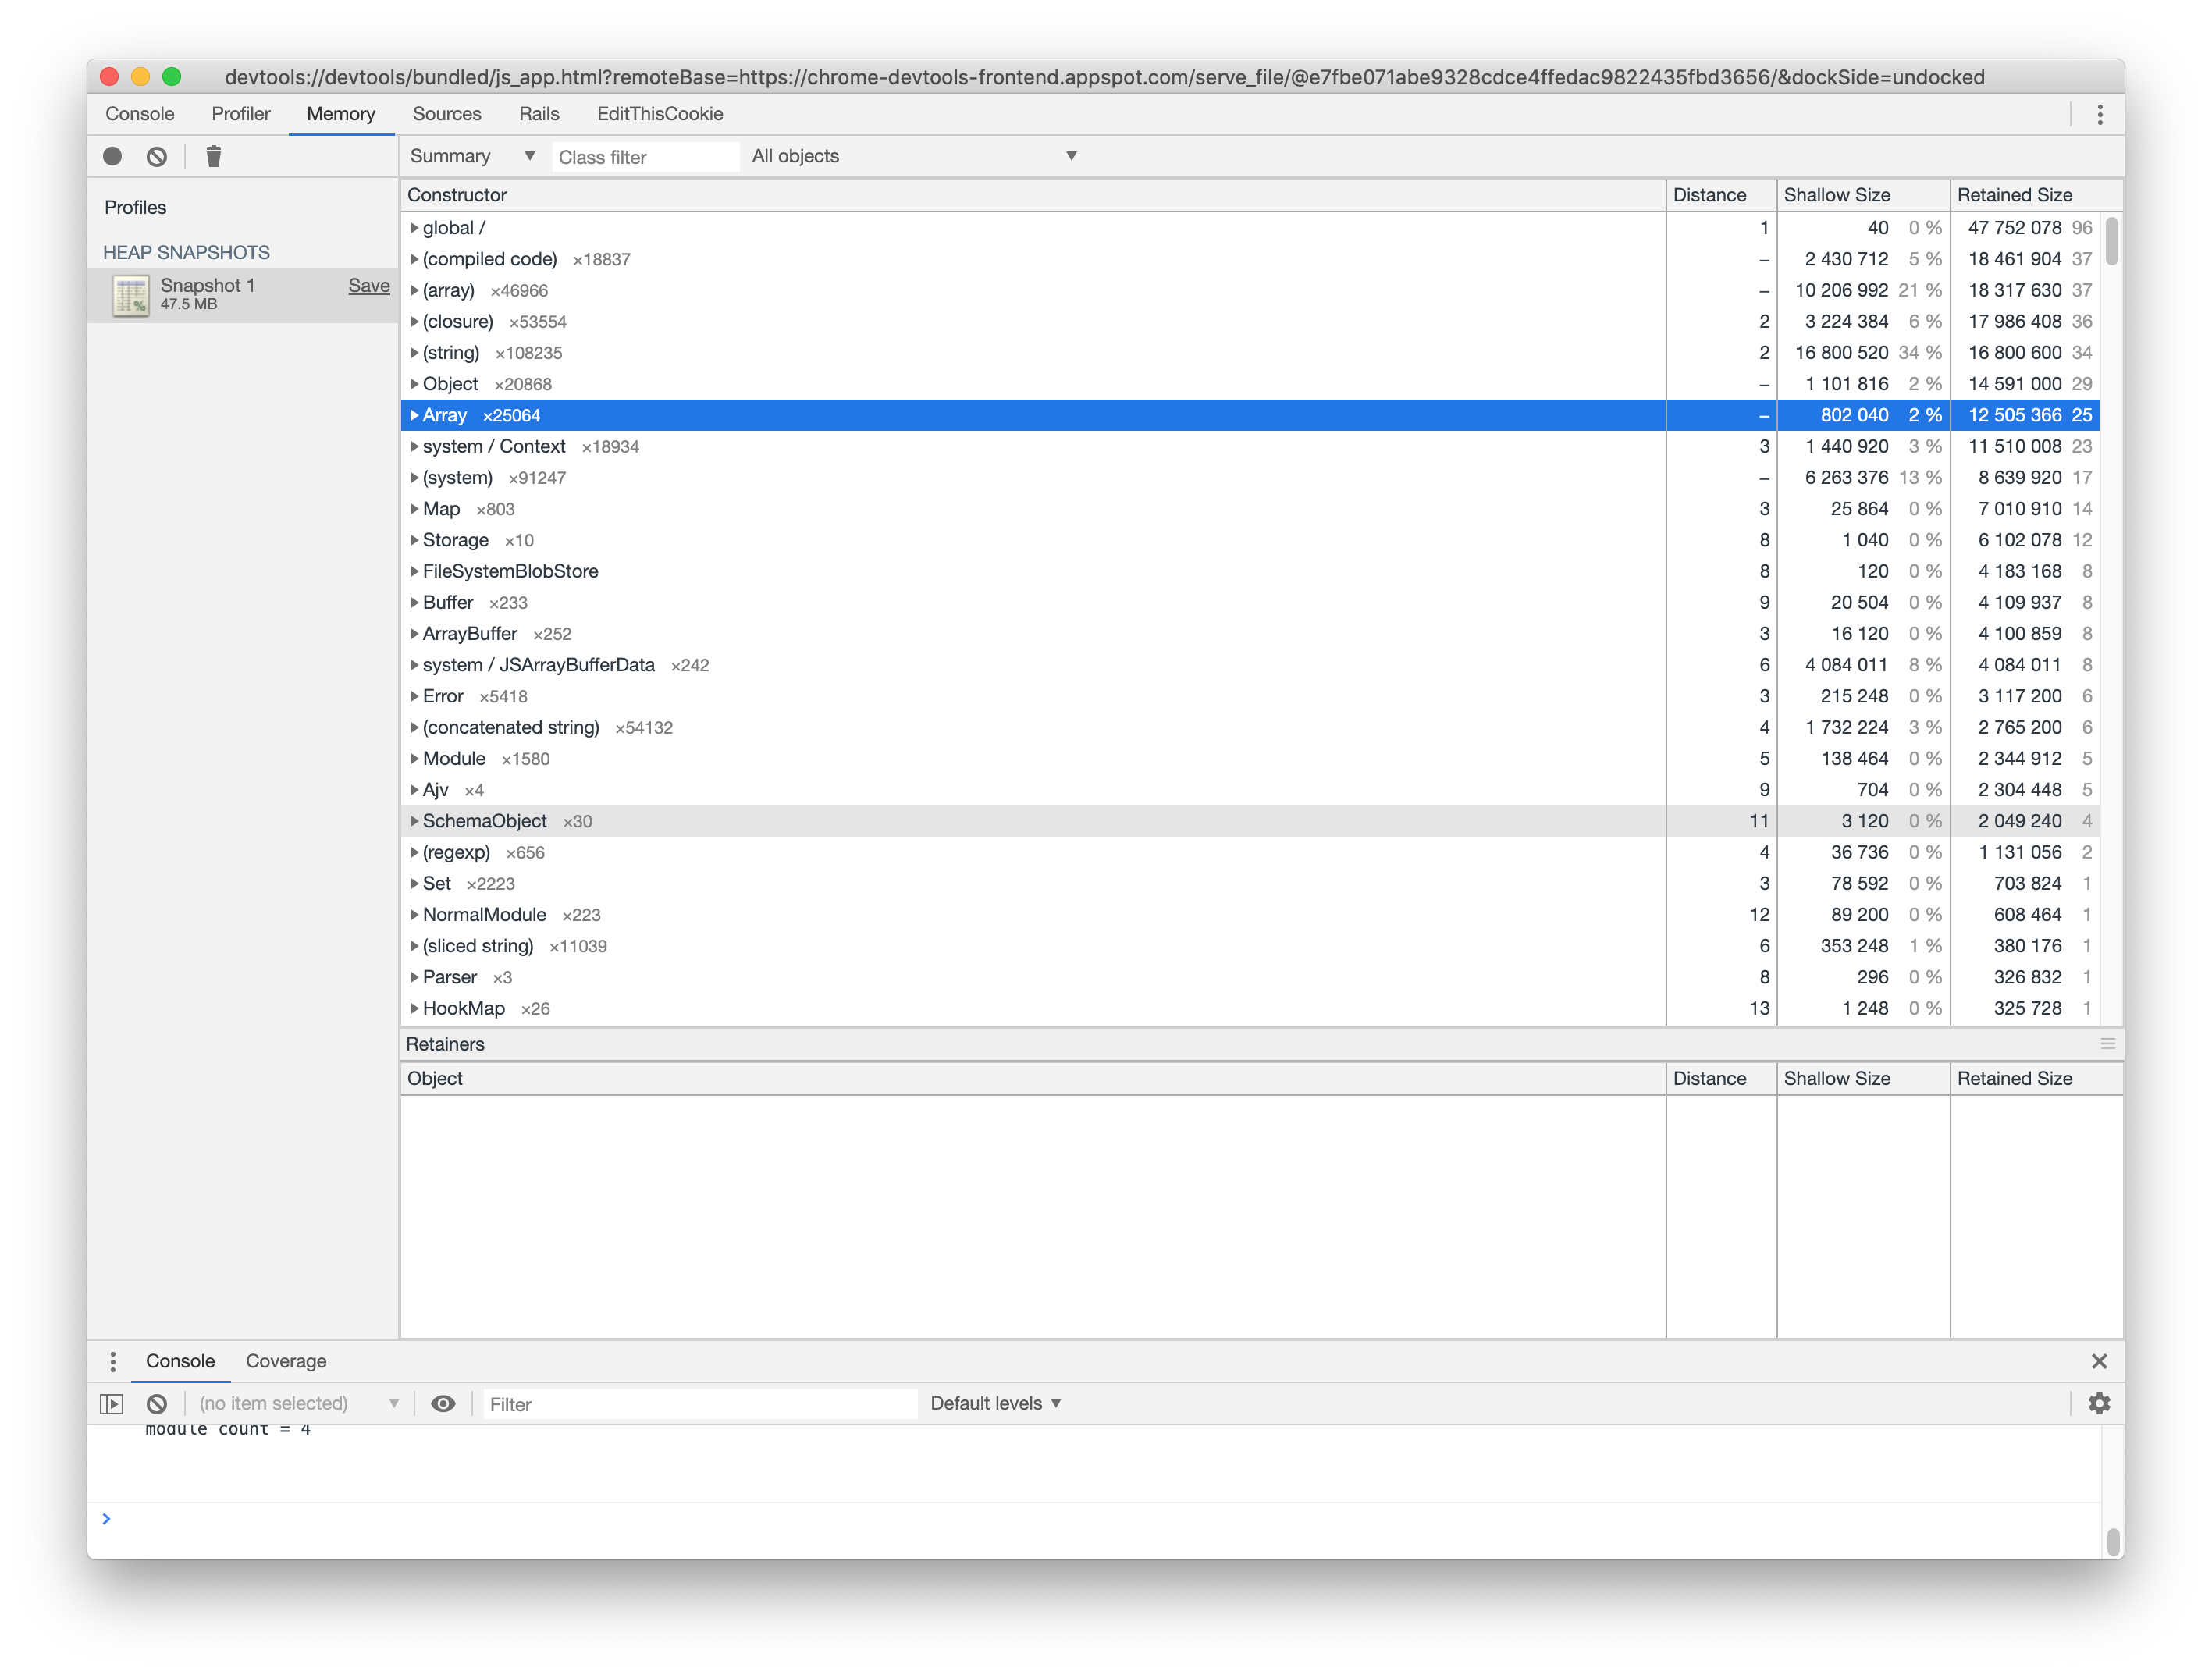
There's more on using DevTools with webpack on the webpack blog.
Speed measure plugin
To help isolate slow parts of your build, I highly recommend the Speed Measure Plugin for webpack. This is a plugin you would install and configure in your project temporarily to get feedback about individual parts of the build process.
First, install the plugin:
yarn add speed-measure-webpack-plugin
Then temporarily configure your production build (you could also do something similar for development or test):
process.env.NODE_ENV = process.env.NODE_ENV || 'production'

const environment = require('./environment')

const SpeedMeasurePlugin = require('speed-measure-webpack-plugin')
const smp = new SpeedMeasurePlugin()

module.exports = smp.wrap(environment.toWebpackConfig())
And then run the production build:
$ RAILS_ENV=production NODE_ENV=production ./bin/webpack
The Speed Measure plugin will print information to $stdout which may help identify the slow parts:
 SMP  ⏱
General output time took 3.094 secs

 SMP  ⏱  Plugins
CaseSensitivePathsPlugin took 0.391 secs
TerserPlugin took 0.306 secs
WebpackAssetsManifest took 0.066 secs
CompressionPlugin took 0.019 secs
MiniCssExtractPlugin took 0.001 secs
OptimizeCssAssetsWebpackPlugin took 0.001 secs
EnvironmentPlugin took 0 secs

 SMP  ⏱  Loaders
modules with no loaders took 1.27 secs
  module count = 365
babel-loader took 0.824 secs
  module count = 4
See How to boost the speed of your webpack build and the official webpack build performance docs for a number of useful tips for improving build/compilation performance.
Wrapping up
Even though Webpacker hides away much of the complexity of webpack configuration, sometimes it's necessary to peel back the abstraction layer. Like anything else that's new, wrapping your head around webpack build can be intimidating, especially if you don't know where to start. If things go wrong, all is not lost. Hopefully this post helped illustrate some ways you can get insight into what's happening in your Rails webpack config.
